EURUSD lost additional ground last week following the July 5th retest of former channel support as new resistance. I mentioned the retest of this key inflection point on July 5th shortly before the pair lost an additional 40 pips.
With Friday’s close below the 1.1060 handle, traders can begin watching for selling opportunities for a move toward the next support at 1.0940. This level is close to the post-Brexit lows and is also the 61.8% Fibonacci level from the December 2015 low of 1.0515 to the 2016 high of 1.1615.
The calendar is relatively light this week for both the Euro and US dollar. However, as I mentioned last week, it seems that these days the unscheduled events, as well as comments from policy planners, can often move the needle more than the scheduled event risk. With this in mind, strict discipline and patience need to remain our top priority.
In summary, I continue to favor selling weakness as long as the pair remains below 1.1200 on a daily closing basis. The post-Brexit close below channel support seems to have opened the door for an extended move lower toward the current 2016 low of 1.0710 and possibly the 2015 lows near 1.0515.
Want to see how we are trading these setups? Click here to get lifetime access.

Not surprisingly, the British pound continued its slide against the US dollar last week. That makes three consecutive losing weeks for the GBPUSD and a total of 2,000 pips lost since the pre-Brexit high of 1.5016.
With last Wednesday’s close below the 1.30 handle, there isn’t much standing in the way of a move toward the 1.2500 support level.
Aside from the 1985 low of 1.0530, identifying support levels going forward could become more challenging than usual. The reason is that the GBPUSD is now visiting prices last seen more than 30 years ago. And depending on your broker, the precision of that pricing data could be spotty at best.
For this reason, it may be preferable to play any further weakness in the British pound via its currency crosses where key levels are easier to spot.

USDCHF tested the upper boundary of a pattern I mentioned in last week’s forecast. Last Friday’s rejection from this area confirms that the price structure you see below is accurate. It also means that a close above it could lead to a favorable buying opportunity.
In the week ahead, traders can watch for a close above channel resistance as a sign of continued strength. Such a close would first target parity with a break above that exposing the multi-year high at 1.0330.
All in all, I like USDCHF higher as long as buyers can muster a daily close above channel resistance that extends from the current 2016 high at 1.0225.
Want to see how we are trading these setups? Click here to get lifetime access.

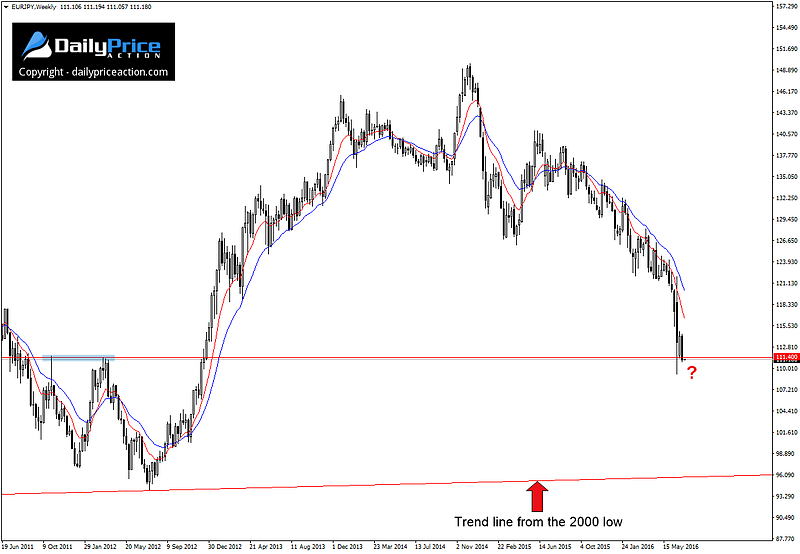
Like all other currencies against the Japanese yen, EURJPY has lost considerable ground over the last year or more. The pair is off its June 2015 high by a substantial 3,000 pips and off its December 2014 high by an even greater 3,800 pips.
Most recently I commented on the USDJPY, which by Friday’s close had triggered a potential selling opportunity of its own. However, I’m bearish the Euro versus the US dollar and at the same time bullish the Japanese yen.
So while a USDJPY short could still be a profitable endeavor, a quick study of relative strength and weakness indicates that EURJPY could be the more logical candidate for those looking to take advantage of continued yen strength.
A big picture view of EURJPY reveals what could be an early indication of where the yen cross is heading over the next few weeks and months.

A close below the highs from 2011 and 2012 at 111.40 could spark enough interest from sellers to eventually push the pair toward the 100 handle and possibly as low as 96.50. Of course, a move of this size would likely take several months to play out.
In the near-term, traders can watch for a selling opportunity as long as the pair remains below the 111.40 handle on a daily closing basis. Immediate support comes in at the post-Brexit low of 109.22.

Since 2008, EURAUD has carved out a wedge pattern that spans an impressive 9,300 pips. The support level of this structure was just tested for a fourth time last Friday.

A daily close below the level that extends from the 2012 lows would open the door for a move toward the 1.4385 support handle with a break below that exposing the 2015 lows near 1.3740.
On the other hand, the more conservative trader could forgo the close below wedge support and wait for a break below the 1.4385 horizontal level before considering an entry. Either way, this Euro cross could be gearing up for a significant drop unless buyers come out in force this week.
The most notable event this week that will affect the EURAUD are the Australia employment figures on July 13th at 9:30 pm EST.
Want to see how we are trading these setups? Click here to get lifetime access.

